What is an Infographic? Design Tips for 2024

Infographics have revolutionized the way we communicate complex information in a visually appealing and easily digestible format.
As we step into 2024, the role of infographics in conveying data and narratives has become more significant than ever.
The Definition and Evolution of Infographics
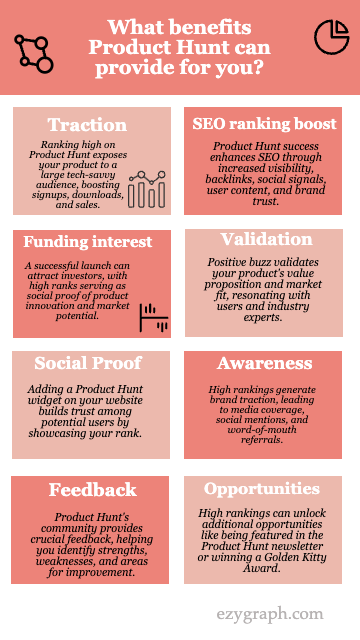
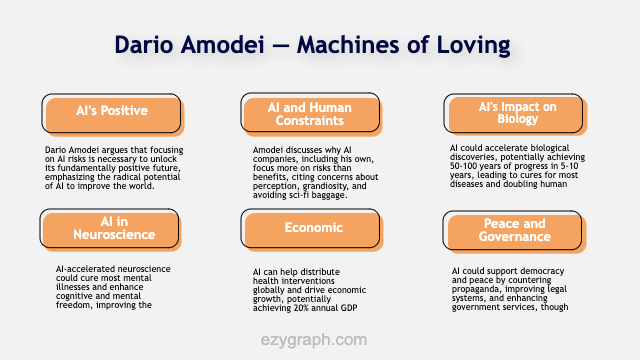
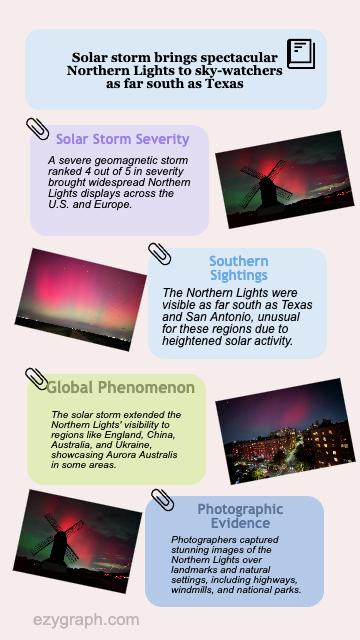
An infographic, short for information graphic, is a visual representation of information or data.
It combines imagery, data visualizations including charts and graphs, and minimal text to provide an easy-to-understand overview of a topic.
The effectiveness of infographics lies in their ability to communicate information quickly and clearly, capturing attention and enhancing memory retention.
The Benefits of Using Infographics
Infographics are valuable for making complex information easy to digest. They are particularly useful for providing quick overviews, explaining processes, displaying research findings, summarizing lengthy content, and raising awareness about issues or causes.
When words alone fall short, infographics offer a visual aid that can simplify and clarify.

Types of Infographics
There are various types of infographics, each suited for different purposes:
- Statistical Infographics: Focus on numbers and data visualizations.
- Informational Infographics: Provide a high-level explanation of a topic with more text than other types.
- Timeline Infographics: Showcase events in chronological order.
- Process Infographics: Visualize step-by-step procedures.
- Comparison Infographics: Highlight similarities and differences between multiple subjects.

Design Best Practices for 2024
To create an effective infographic, consider the following best practices:
- Group Related Information: Use lines, borders, and shapes to group related information, making your infographic easier to scan and understand.
- Contrasting Colors: Use contrasting colors to guide your readers' attention, highlighting key information and pushing supporting details into the background.
- Text Hierarchy: Create a clear text hierarchy with three different font styles for main headings, section headings, and body text.
- Visual Elements: Use images, icons, and illustrations to make key takeaways memorable and enhance the storytelling aspect of your infographic.

For those looking to create infographics without the hassle of complex design tools, EzyGraph offers a seamless solution.
With its AI-powered technology, EzyGraph transforms your content into stunning infographics in minutes, saving you time and effort while enhancing the visual appeal of your communication.
Whether you're a blogger, content creator, or marketer, EzyGraph is the future of content visualization, making it easier than ever to create impactful infographics that resonate with your audience.