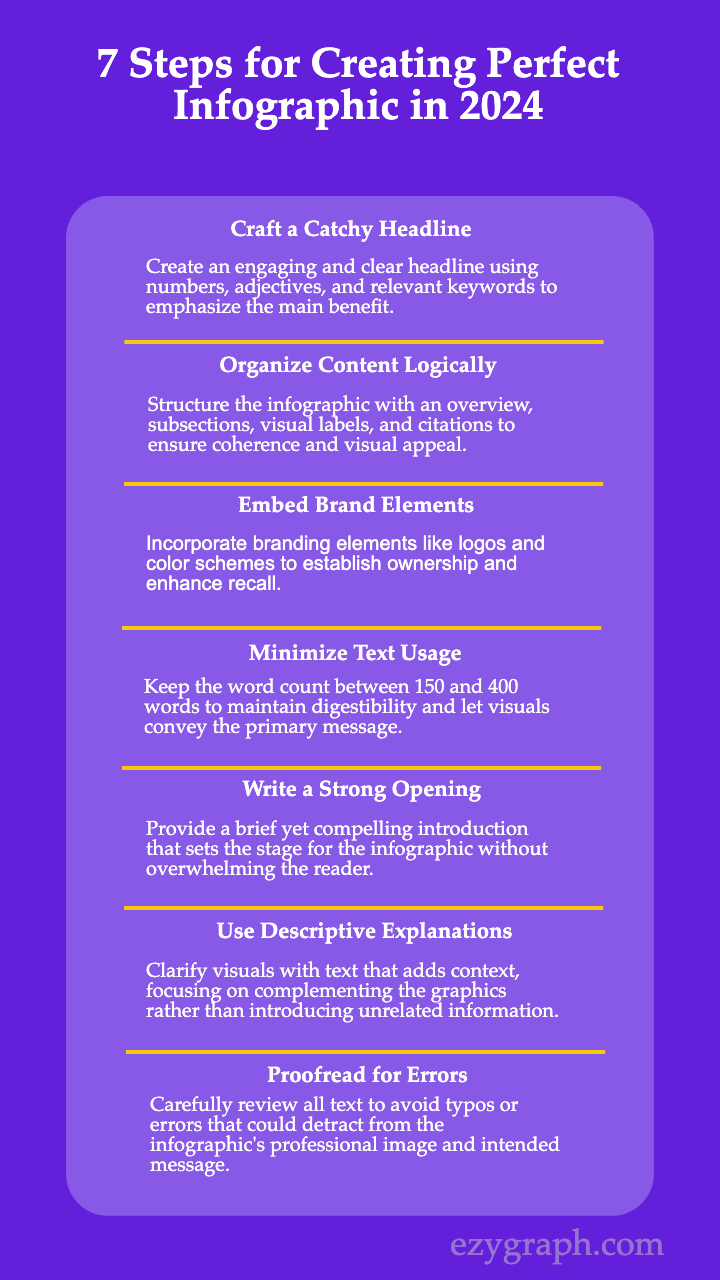
7 Steps for Creating Perfect Infographic in 2024

Infographics are powerful tools for sharing information succinctly while making complex topics more digestible. With the right combination of visual appeal and informative content, infographics can educate, engage, and captivate readers.
Here's a step-by-step guide to creating an infographic that will resonate with your audience in 2024.

1. Craft a Catchy Headline
The headline of your infographic is your hook, so make it engaging and clear. Utilize numbers, descriptive adjectives, and relevant keywords.
Emphasize the main benefit the reader will gain from viewing your infographic. For example, a title like “5 Essential Tips for Better Time Management” immediately shows value and relevance.
2. Organize Your Content Logically
An effective infographic is structured in a way that guides the reader effortlessly through the information. Here’s a suggested outline:
- Overview: Introduce the main idea succinctly.
- Subsections: Use headings to segment the content and make it easy to follow.
- Visual Labels: Keep labels on charts and graphs simple and informative.
- Citations and Credits: Include references at the bottom to add credibility if external sources were used.
This format ensures that your infographic is coherent and visually appealing.
3. Embed Your Brand Elements
Branding within your infographic is essential to establish ownership and enhance recall.
Add a logo, website link, or incorporate your brand’s color scheme into the design. This helps promote your brand while making the infographic more visually consistent and identifiable.
4. Keep Text to a Minimum
One common question is, how much words is an infographic ideally? The general rule is that visuals should outweigh text.
Aim for a total word count between 150 and 400 words. This keeps the infographic digestible and allows the visuals to convey the primary message, with text playing a supporting role.
5. Write a Strong Opening
Your introductory text should be brief yet compelling, setting the stage for the rest of the infographic. This section should highlight the topic and provide essential context.
Limit this part to a couple of hundred words or less to avoid overwhelming the reader and to maintain their attention.
6. Use Descriptive Explanations
While visuals carry the weight of an infographic, the accompanying text should clarify what the reader is seeing.
Avoid introducing unrelated information; instead, focus on adding context that complements the graphics. This ensures that your audience fully understands the visuals and their significance.
7. Double-Check for Errors
A final but crucial step is to proofread all text included in your infographic. A single typo or error can detract from your professional image or even alter the intended meaning. Carefully review all content to maintain credibility and ensure that your message is clear and accurate.
conclusion
A successful infographic is a balance between engaging visuals and informative text. Following these seven steps will help you create a compelling and effective infographic that enhances your brand’s presence and captures your audience’s attention in 2024.
For those looking to simplify and speed up the process, consider using EzyGraph. This innovative, AI-powered tool is perfect for bloggers and content creators who want to transform written content or URLs into eye-catching infographics with ease.
EzyGraph automates the design process, saving you time and boosting the visual impact and engagement of your content. Plus, you can customize templates to fit your unique needs. Give EzyGraph a try to elevate your content creation effortlessly.